Golang binaries are a bit hard to analyze but there are some tricks to locate the things and view what is doing the code.
Is possible to list all the go files compiled in the binary even in an striped binaries, in this case we have only one file gohello.go this is a good clue to guess what is doing the program.
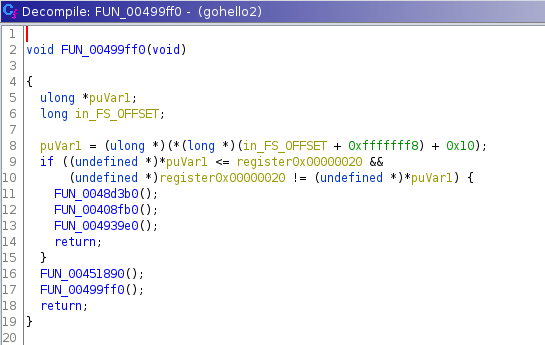
On stripped binaries the runtime functions are not resolved so is more difficult to locate the user algorithms:
If we start from the entry point, we will found this mess:
The golang string initialization are encoded and is not displayed on the strings window.
How to locate main? if its not stripped just bp on [package name].main for example bp main.main, (you can locate the package-name searching strings with ".main")
And here is our main.main:
The code is:
So in a stripped binary we cant find the string "hello world" neither the initialization 0x1337 nor the comparator 0x1337, all this is obfuscated.
The initialization sequence is:
The procedure for locating main.main in stripped binaries is:
1. Click on the entry point and locate the runtime.mainPC pointer:
2. click on runtime.main function (LAB_0042B030):
3. locate the main.main call after the zero ifs:
4. click on it and here is the main:
The runtime is not obvious for example the fmt.Scanf() call perform several internal calls until reach the syscall, and in a stripped binary there are no function names.
In order to identify the functions one option is compile another binary with symbols and make function fingerprinting.
In Ghidra we have the script golang_renamer.py which is very useful:
After applying this plugin the main looks like more clear:
This script is an example of function fingerprinting, in this case all the opcodes are included on the crc hashing:
# This script fingerprints the functions
#@author: sha0coder
#@category fingerprinting
print "Fingerprinting..."
import zlib
# loop through program functions
function = getFirstFunction()
while function is not None:
name = str(function.getName())
entry = function.getEntryPoint()
body = function.getBody()
addresses = body.getAddresses(True)
if not addresses.hasNext():
# empty function
continue
ins = getInstructionAt(body.getMinAddress())
opcodes = ''
while ins and ins.getMinAddress() <= body.getMaxAddress():
for b in ins.bytes:
opcodes += chr(b & 0xff)
ins = getInstructionAfter(ins)
crchash = zlib.crc32(opcodes) & 0xffffffff
print name, hex(crchash)
function = getFunctionAfter(function)
Related word
- Hacker Tools Free Download
- Hack Apps
- Pentest Tools Tcp Port Scanner
- Hacker Search Tools
- Pentest Tools Android
- Wifi Hacker Tools For Windows
- Nsa Hack Tools
- Hack Tool Apk No Root
- Best Hacking Tools 2020
- Pentest Tools Alternative
- Pentest Tools For Android
- Hack Website Online Tool
- Hacking Tools Name
- Hacking Tools For Windows 7
- Best Hacking Tools 2020
- Hacker Techniques Tools And Incident Handling
- New Hack Tools
- Hack Tool Apk No Root
- Hacking Tools For Windows 7
- Pentest Tools List
- Hacker Tools Apk
- Hacking Tools For Mac
- Hack Tools Download
- Hacking Tools Name
- Pentest Tools Alternative
- Hack Apps
- Hacker Tools Online
- Easy Hack Tools
- How To Make Hacking Tools
- Hacker Tools Github
- Pentest Tools Download
- Hacking Tools 2019
- Hacking Apps
- Pentest Automation Tools
- Best Hacking Tools 2019
- Hack App
- Pentest Tools Subdomain
- Hacking Tools 2020
- Hacking Tools Software
- Physical Pentest Tools
- Hacker Tools
- Hacker Tools For Ios
- Hacking Tools Download
- Hacker Hardware Tools
- Hacking Tools For Games
- Hacker Security Tools
- Hack Tools
- Pentest Tools Framework
- Hacker Tools Github
- Hak5 Tools
- Usb Pentest Tools
- Hacking Tools For Beginners
- Hacker Tools For Ios
- Hack Tools For Games
- Hacker
- Hack App
- Pentest Tools Bluekeep
- World No 1 Hacker Software
- Hacking Tools Kit
- Hacker Tools Free Download
- Hacker Tools Apk Download
- Termux Hacking Tools 2019
- How To Hack
- Hacking Tools For Windows Free Download
- Hack Rom Tools
- Kik Hack Tools
- Easy Hack Tools
- Blackhat Hacker Tools
- Underground Hacker Sites
- Pentest Tools Open Source
- Usb Pentest Tools
- Hacking Tools 2019
- What Is Hacking Tools
- Easy Hack Tools
- Black Hat Hacker Tools
- Hack Tools Github
- Hack Tools For Games
- How To Hack
- Pentest Tools List
- Pentest Tools List
- Pentest Tools Website Vulnerability
- Hacking Tools Hardware
- Hacker Tools Online
- Pentest Tools Open Source
- Hacking Tools Windows
- Game Hacking
- Tools Used For Hacking
- Nsa Hack Tools Download
- Hacker Tools Apk Download
- Pentest Tools Alternative
- Game Hacking
- Hacker Tools
- Hack Tool Apk No Root
- How To Make Hacking Tools
- Hacking Tools Online
- Hacker Tools
- Best Pentesting Tools 2018
- Best Pentesting Tools 2018
- Black Hat Hacker Tools
- Pentest Tools
- Hack Website Online Tool
- Pentest Tools Kali Linux
- Hacker Tools Apk Download
- Hacker Tools Linux
- Pentest Tools Find Subdomains
- Hacking Tools
- Nsa Hack Tools Download
- Install Pentest Tools Ubuntu
- Wifi Hacker Tools For Windows
- Hacker Tools Software
- Pentest Tools Android
- Game Hacking
- Hacker Tools For Windows


